Charting
Charting is where clinicians produce the durable record of care – the patient summary read at every visit, the encounter notes captured during one, and the orders and follow-up that come out of it. Medplum is headless: your app owns the screens, while the underlying FHIR data model keeps the record interoperable, queryable, and reusable.
Where to Start
- Designing Charting – discovery questions (visit types, parsing, signing, template ownership).
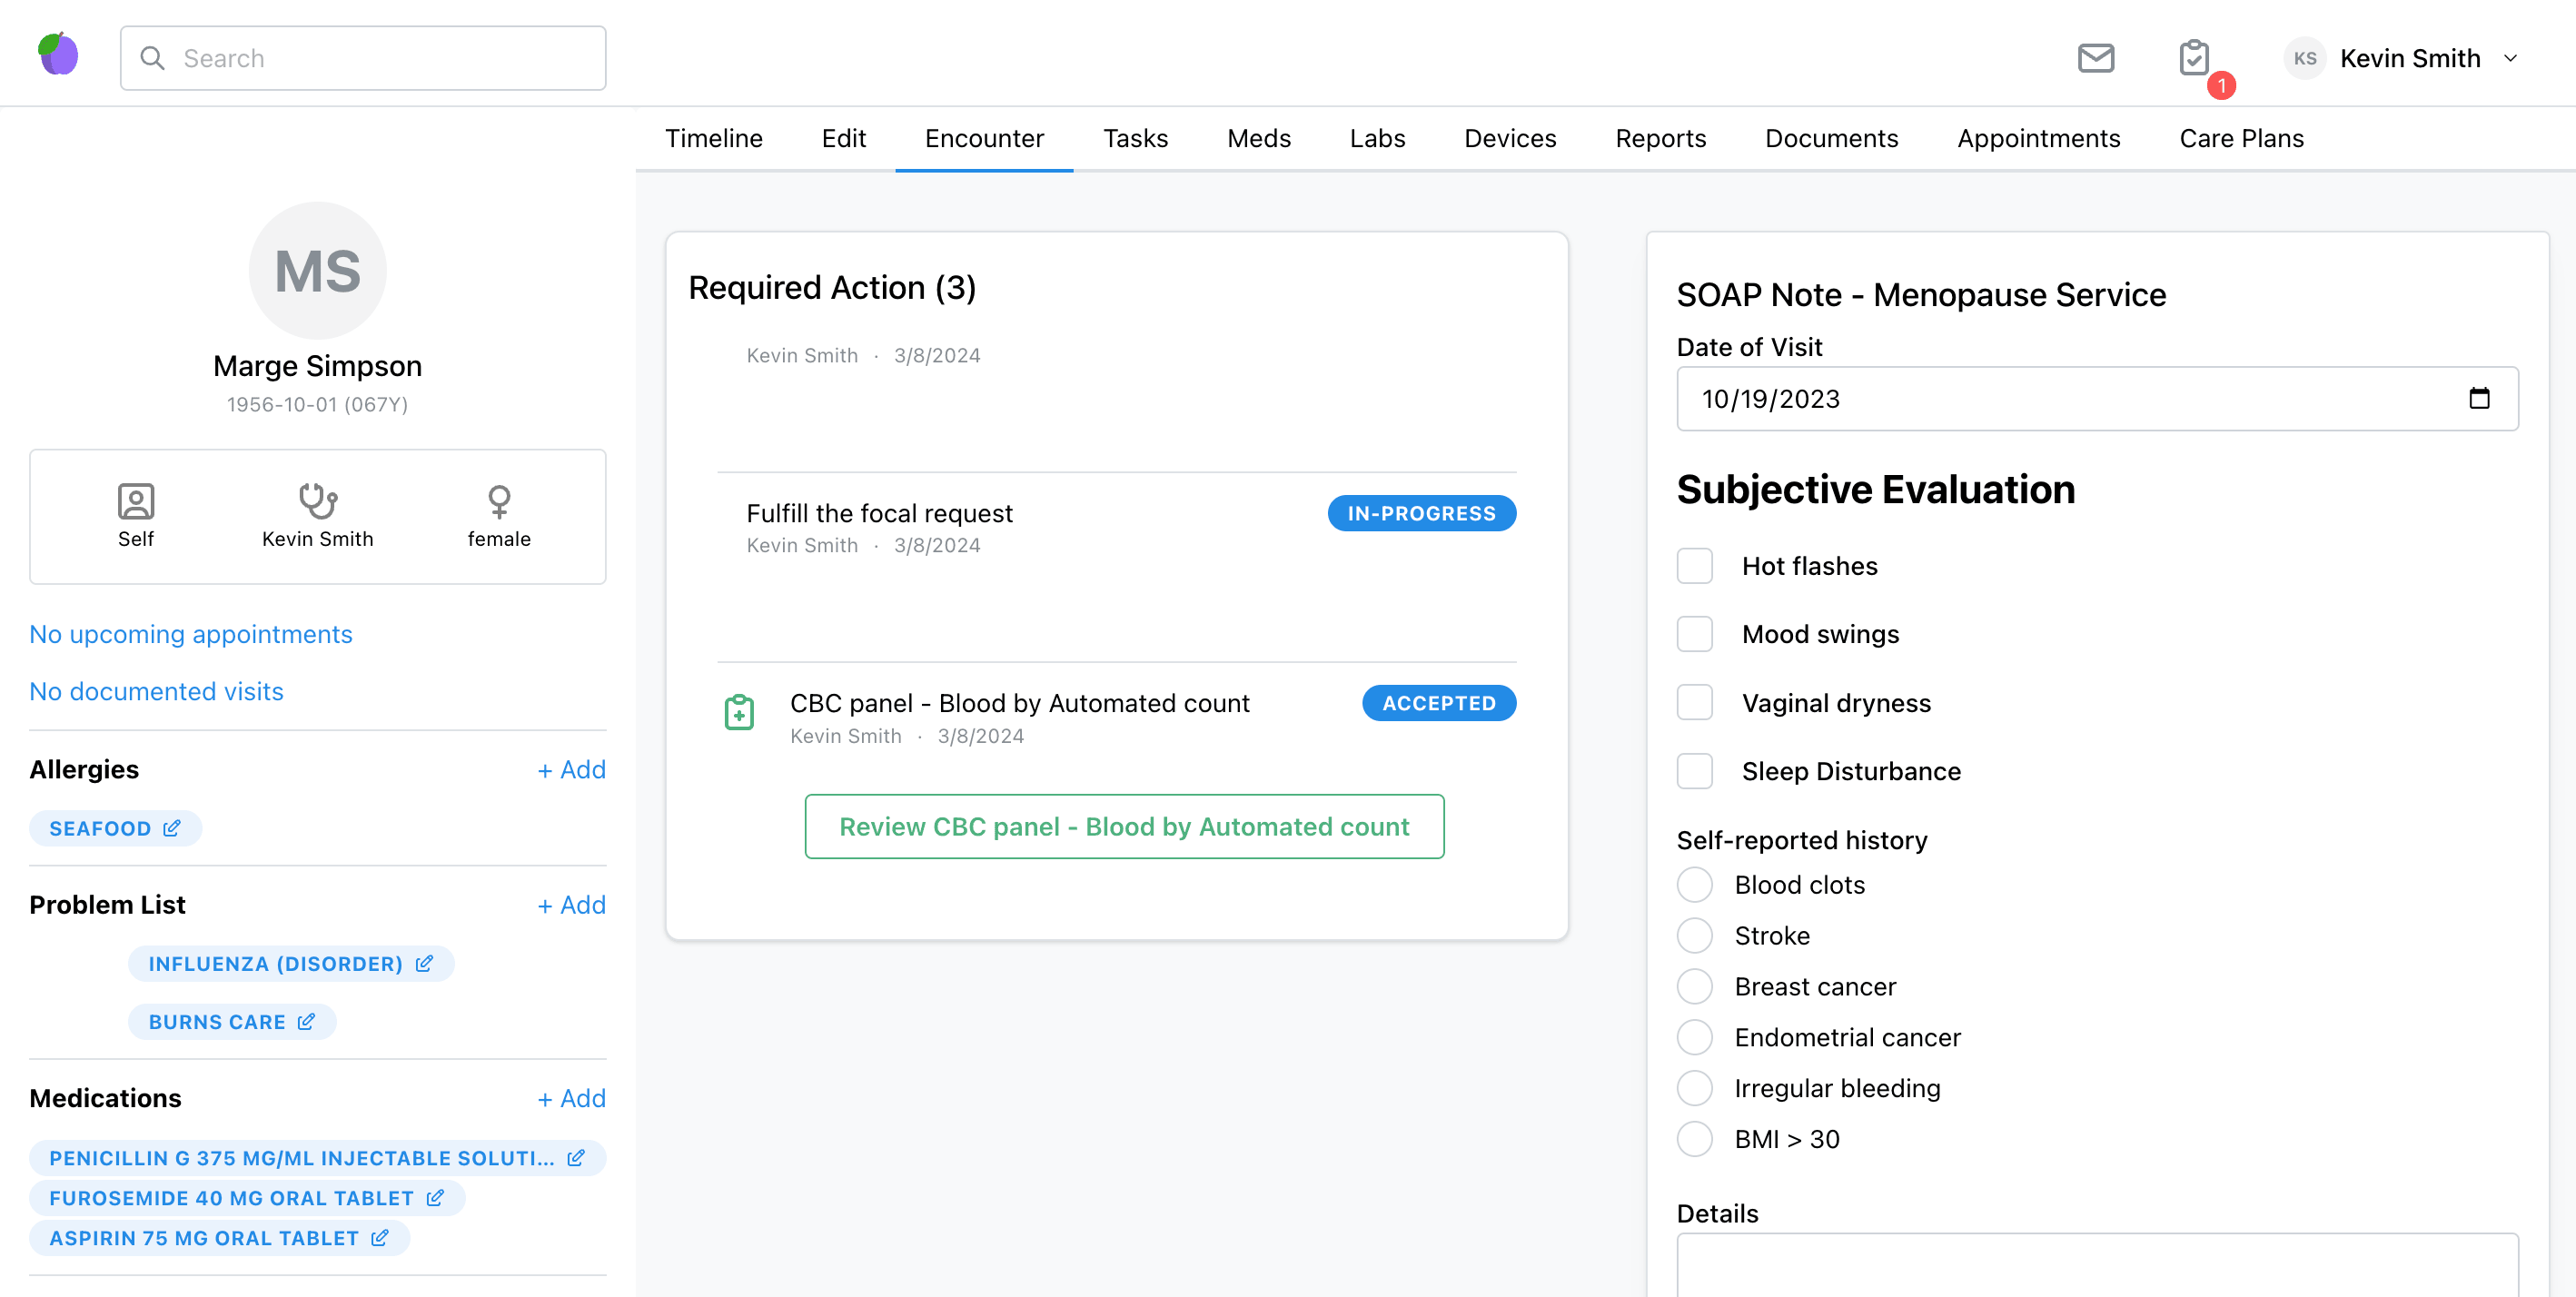
- Visit Templates and the SOAP Approach –
PlanDefinition, SOAP mapped to structured S/O/P plus narrative assessment,$apply, signing. - Chart Data Model – Patient, Observation, Condition, allergies, devices, vitals, and queries for the chart UI.
Supporting guides:
- Parsing Questionnaire Responses –
$extractversus Bots for questionnaire responses. - Provider Visits – Care Templates and Provider app setup (UI-specific).
- Authoring Clinical Protocols – advanced PlanDefinition composition.
Sample Application
Charting can look however you want. A reference UI built from Medplum React components lives in medplum-provider.
Orders and Billing
Orders are usually ServiceRequest and MedicationRequest resources, optionally spawned from ActivityDefinitions in visit templates. See Labs and Imaging, Medications, and Provider visits for billing-oriented ChargeItem flows.